
Stock Chart provides a graphical presentation of product sales which assists users to understand product performance.
With sales charts, users will have access to the following information more readily on the business.
- Top 5 performing products during a specific period in terms of sales
- Total quantity of products sold during a specific period
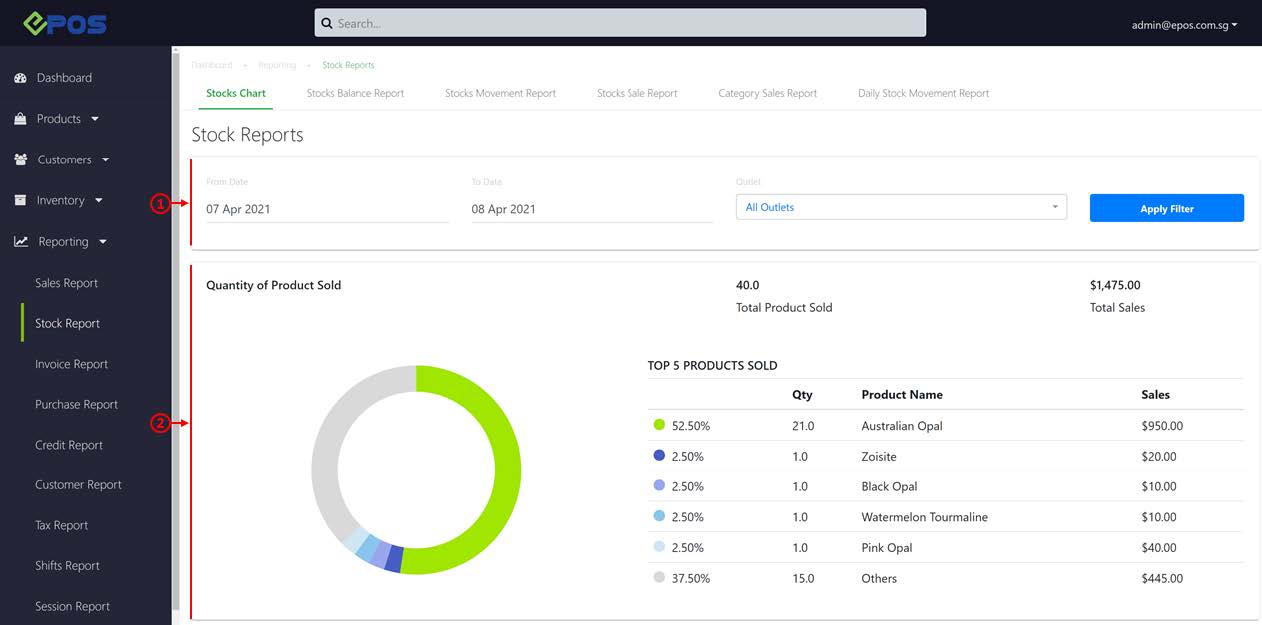
1. Dates and Outlet Filter
Allow users to filter the stock chart based on specific dates and the specific outlet. Click on Apply Filter to show a chart.
2. Stock Chart
Show users the top 5 products, total quantity of products sold and total sales made with tax.
Was this article helpful?
YesNo