No products in the cart.
Sales Chart provides a graphical presentation of sales data to users which assists users to understand sales performance more holistically and accurately.
With sales charts, users will have access to the following business information readily.
- Peaks and troughs of business operations.
- Best and worst performing staff or salespersons.
- Most frequent mode of payments made by customers.
Accessing the Sales Report page, by default, users will be directed to the Sales Chart.

1. Dates and Outlet
Filter Allow users to filter the sales chart based on specific dates and outlets. Click on Apply Filter to show a chart.
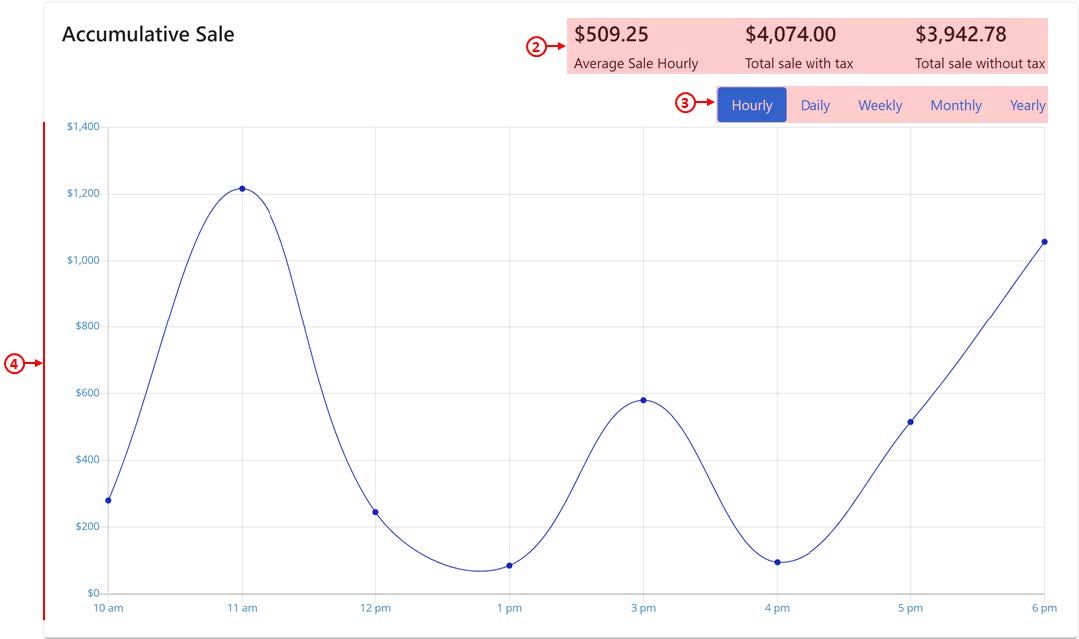
2. Sales Breakdown
Show users the calculated average sales, total sales with tax, total sales without tax. Will also be updated based on the timeframe toggled in No.3.
3. Accumulative Sales Timeframe Toggler
Allow users to toggle between different timeframes: hourly, daily, weekly, monthly and yearly. This will update the sales breakdown and accumulative sales chart.
4. Accumulative Sales Chart
Based on filtered criteria, accumulative sales charts will be tabulated correspondingly.
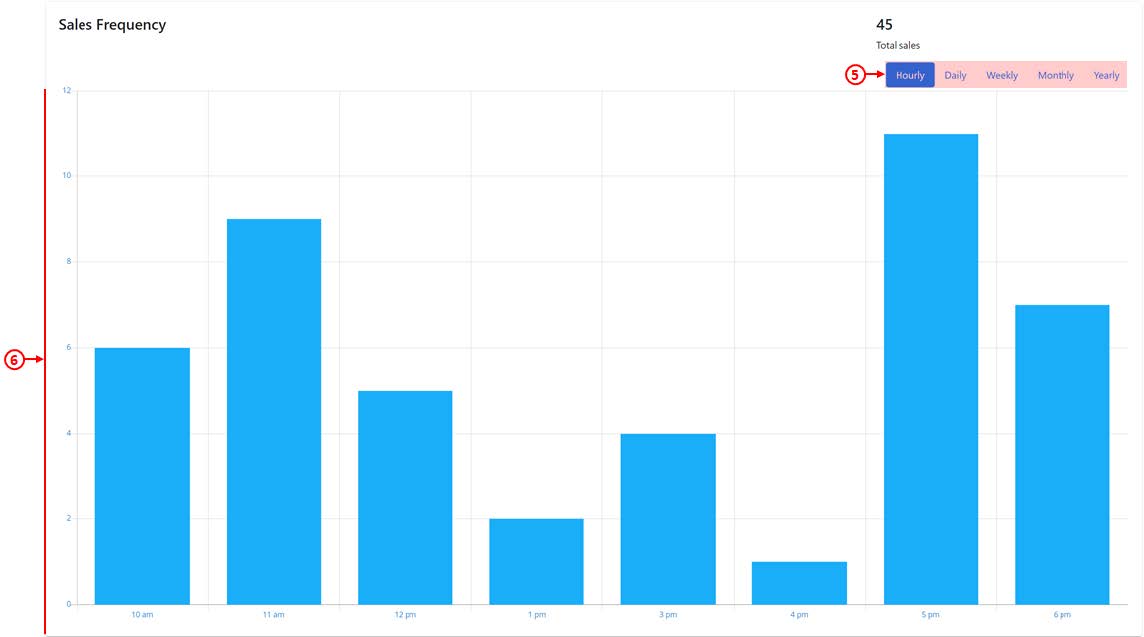
5. Sales Frequency Timeframe Toggler
Allow users to toggle between different timeframes: hourly, daily, weekly, monthly and yearly. This will update the sales frequency chart.
6. Sales Frequency Chart
Based on filtered criteria, the sales frequency chart will be tabulated correspondingly and show users the graphical depiction of the most active session.
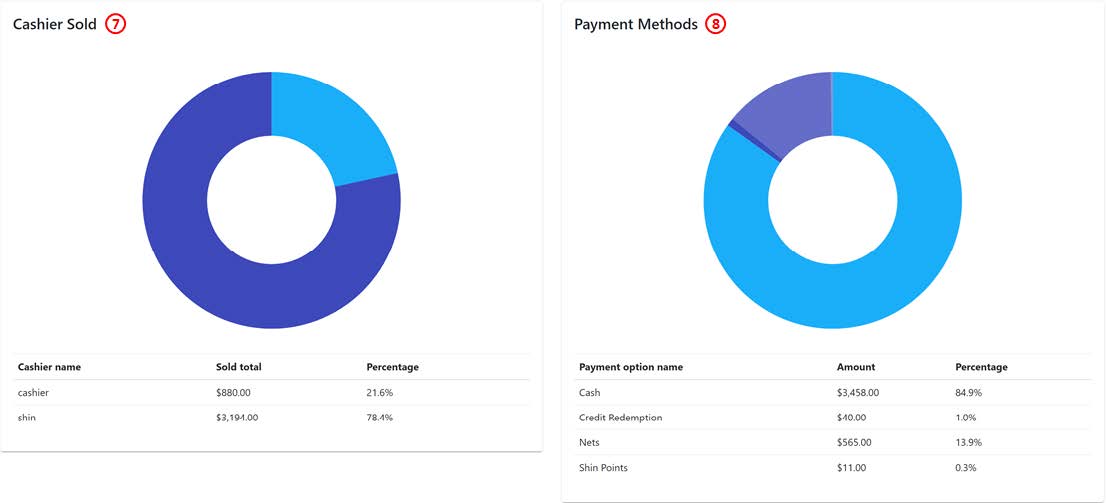
7. Cashier Sales Chart
Based on filtered criteria, the cashier sales chart will be tabulated and broken down by each cashier in terms of sales amount and percentage.
8. Payment Methods Chart
Based on filtered criteria, different payment methods used for all sales made will be tabulated and broken down in terms of sales amount and percentage.
Was this article helpful?
YesNo