
Stocks Sale Report allows users to review the total sales broken down to each product recorded from all POS terminals in every outlet. Stocks Sale Report is usually used to review the breakdown of revenue by product/ product category sales within a specified period.
To access the Stocks Sale Report, under Stock Report, click on the Stocks Sale Report tab.
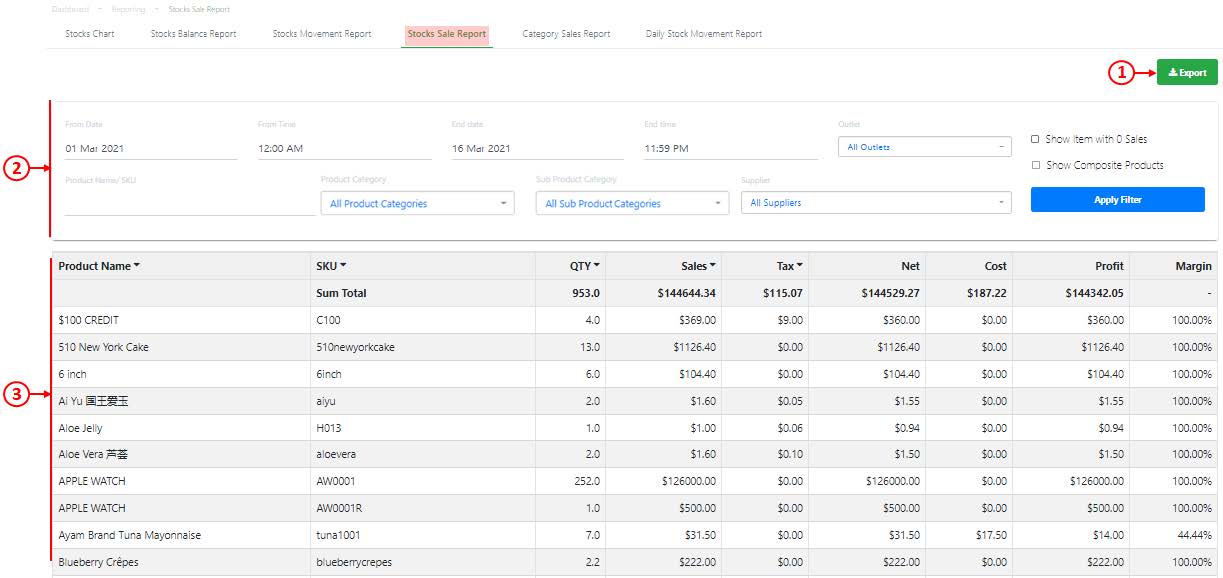
1. Export
Allow users to export the Stocks Sales Report based on the filtered criteria.
💡 Users are advised to export the report for any further analysis of data generated.
2. Search and Filter
Allow users to generate a Stocks Sales Report based on date and time range, product name / SKU, outlet, product categories and supplier.
Click on Apply Filter to generate a report.
💡 ☑️ Show item with 0 Sales to show items with zero sales.
💡 ☑️ Show composite Products to show sold composite products in the stock sales report.
3. Stocks Sales Report
Report generated will be based on the filtered criteria made in No.2.
💡 Net = Sales – Tax
💡 Input Tax : For products to carry input tax, users must create stock-in / PO with relevant inpt tax. (refer to Creating a New Stock-In or Creating a new Purchase Order)
💡 For companies with No tax rules : Profit = Net – Cost
💡 For companies with Tax Inclusive and Tax Exclusive : Profit = Net- Net Cost
💡 Margin = (Profit/Net) x 100%